

How To Find The Rate Of Change In A Table - If you've ever had to analyze data, you know that there's often more than one way to look at it. One common question that comes up in data analysis is how to find the rate of change, given a table of values. Fortunately, there are some straightforward techniques you can use to do just that. In this post, we'll explore some tips and tricks for finding the rate of change in a table, so you can get the insights you need from your data.
What Is Rate Of Change?
Before we dive into how to find the rate of change in a table, let's quickly define what rate of change means. At a basic level, "rate of change" refers to how much something is changing over time. For example, if you're tracking the number of visitors to your website each month, the rate of change would tell you how fast that number is growing (or shrinking, as the case may be).
More formally, the rate of change is the amount of change in a variable divided by the amount of time that change took place. You can calculate the rate of change for different variables, such as distance, temperature, production output, and so on. It's a handy way to measure the "speed" of change, and it can help you identify trends and patterns in your data.
Finding Rate Of Change From A Table
Step 1: Identify Your Data Points
The first step in finding the rate of change from a table is to identify the relevant data points. Look at your table and determine which variables are changing over time (or over some other relevant parameter). For example, if you're looking at sales data for a particular product, you might be interested in how the sales revenue is changing from month to month.
Once you've identified the variables you're interested in, look at the table and jot down the data points. For example, if you're tracking sales revenue, you might have a table that looks like this:
| Month | Sales Revenue |
|---|---|
| January | $5,000 |
| February | $6,000 |
| March | $7,000 |
Step 2: Determine The Time Interval
Next, you need to determine the time interval over which your variable(s) changed. In the example above, the time interval is one month.
Step 3: Calculate The Change In The Variable
Now that you've identified your data points and time interval, you can calculate the change in the variable(s) you're interested in. For example, if you're looking at sales revenue, you can subtract the sales revenue for one month from the sales revenue for the next month, to get the change in revenue over that time period. Continuing with the example above, the change in sales revenue between January and February is $1,000.
Step 4: Calculate The Rate Of Change
Finally, you're ready to calculate the rate of change. To do this, divide the change in the variable by the time interval. In the example above, the change in sales revenue between January and February is $1,000, and the time interval is one month, so the rate of change is:
$1,000 / 1 month = $1,000 per month
This tells you that sales revenue is increasing at a rate of $1,000 per month.
Tips And Tricks
Oftentimes, you'll be dealing with more complex tables and data sets that require some additional techniques to analyze the rate of change. Here are a few tips and tricks to keep in mind:
Look For Patterns
When analyzing a table of data, it's often helpful to look for patterns. Are the changes in your variable(s) consistent from one time period to the next, or are there sudden spikes or dips? Are there seasonal trends or cycles that you can identify? Looking for patterns can help you better understand the rate of change and identify underlying factors that may be driving it.
Use Data Visualization
Data visualization tools can be extremely helpful when trying to analyze the rate of change in a table. For example, you might create a line graph showing the changes in your variable(s) over time, or a scatterplot showing how two variables are related.
Consider The Context
Finally, it's important to consider the context in which you're analyzing the rate of change. For example, a rate of change that seems impressive when looking at one month of data might be less impressive when you consider the data over a longer time period, or when you factor in external variables like seasonality, economic trends, or marketing campaigns.
In Conclusion...
Calculating the rate of change from a table can be a simple, straightforward process, or it can require some additional techniques and tools. By following the steps we've outlined above and keeping these tips and tricks in mind, you'll be better equipped to analyze your data and extract meaningful insights from it. Whether you're working with sales data, production output, website traffic, or any other variable, the rate of change can be a powerful tool for identifying trends, patterns, and opportunities to improve your performance. Happy analyzing!
Related Videos:
7-5: Rate of Change from Tables and Written Descriptions part 1

In this video, you'll learn how to find the rate of change given a table or a written description of a situation. The video covers a variety of scenarios, including finding the average rate of change over an interval, finding the instantaneous rate of change at a specific point, and interpreting the rate of change in the context of the problem at hand.
Finding Rate of Change from a Table

Another helpful video on how to find the rate of change from a table. This video walks you through a step-by-step process for identifying your data points, determining the time interval, and calculating the rate of change. The video also covers some common applications of rate of change, and how to interpret the results.
Avg and Instantaneous Rate of Change Table
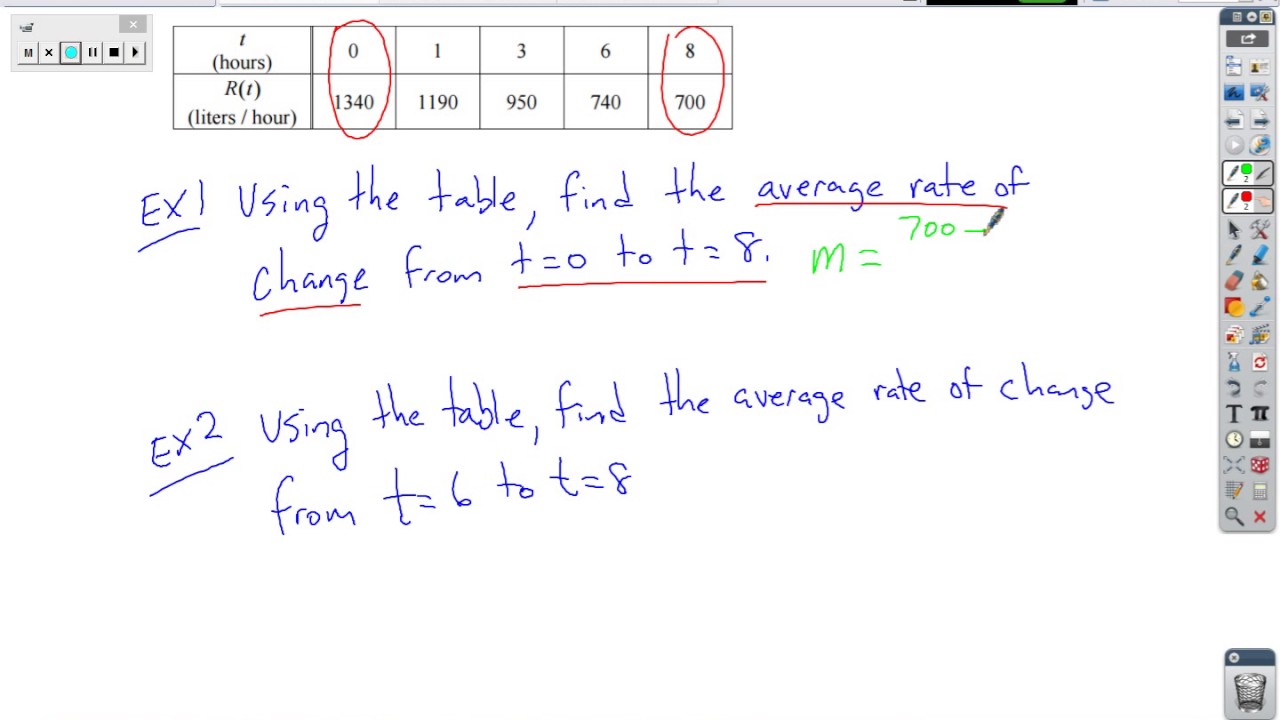
In this video, you'll learn about the difference between average rate of change and instantaneous rate of change. The video discusses how to calculate both types of rate of change from a table, and provides some examples to help solidify your understanding. If you're new to the concept of rate of change, this is a great video to start with.
Read more articles about How To Find The Rate Of Change In A Table